May 9, 2025
Cómo hacer un reporte de ventas en 5 pasos (+ plantilla)
Aprende cómo hacer un reporte de ventas en excel en solo 5 pasos. Además, podrás obtener la plantilla de un reporte para ventas por WhatsApp con las métricas más relevantes.
Ximena Portocarrero

Si alguna vez te has preguntado cómo hacer un reporte de ventas para tu tienda online, estás en el lugar correcto. Porque sí, los reportes no son solo para grandes empresas: también son la clave para que un negocio e-commerce pequeño crezca con inteligencia.
En este artículo, te guiaré paso a paso en cómo crear un reporte de ventas básico en excel. Veremos qué elementos debe tener tu reporte y los tipos de reporte más comunes. Además, podrás descargar un reporte de ventas editable 📊 para registrar tus ventas por WhatsApp.
Gracias al equipo de YaVendió!, expertos en e-commerce, esta plantilla tiene todas las métricas de venta más importantes de WhatsApp ¡Imperdible! ⚡
Pero, iniciemos por lo fundamental:
¿Qué es un reporte de ventas?
Un reporte de ventas es un documento estratégico que recopila y analiza los datos de todas tus ventas en un periodo específico con el objetivo de entender el rendimiento comercial, identificar oportunidades de mejora y tomar decisiones basadas en datos reales.
No se trata solo de saber cuánto se vendió, sino de entender por qué se vendió, a quién, cómo y con qué rentabilidad. Un buen reporte de ventas puede revelar patrones de comportamiento de clientes, el impacto de campañas de marketing y la eficiencia del equipo de ventas.
En negocios donde cada dato cuenta, el reporte de ventas se convierte en una herramienta poderosa para crecer de forma sostenible y con foco en la rentabilidad.
Elementos clave: ¿Qué debe incluir un reporte de ventas?
Todo reporte de ventas profesional debe contener algunos elementos básicos, como:
Fecha, mes o período reportado
Producto o servicio vendido
Cantidad en unidades
Precio unitario y total
Canal de venta (tienda online, WhatsApp, redes, etc.)
Meta u objetivo de venta
Y si quieres un nivel extra de análisis:
Tasa de conversión (te recomiendo este artículo sobre tasas de conversión en e-commerce)
Agente de ventas asignado (si aplica)
Cliente (nombre, zona, tipo)
Costo de adquisición del cliente (CAC)
Margen de ganancia
Tener estos datos bien organizados es el primer paso para comprender el estado de tus ventas.
Cómo hacer un reporte de ventas en Excel en 5 pasos
Ahora que ya sabes qué es un reporte de ventas y qué debe incluir, es momento de pasar a la práctica.
Aquí te explico cómo hacer un reporte de ventas en Excel en 5 pasos. Cada paso está pensado para que tu informe sea claro, fácil de actualizar y útil para tomar decisiones de negocio.
👉 Para este ejemplo, pensemos que tu equipo está en campaña de Navidad y hay un inventario determinado que vender. Por ende, el objetivo es conocer la cantidad de productos que salen y si se llegarán a la meta.
Cómo hacer un reporte de ventas: Paso 1
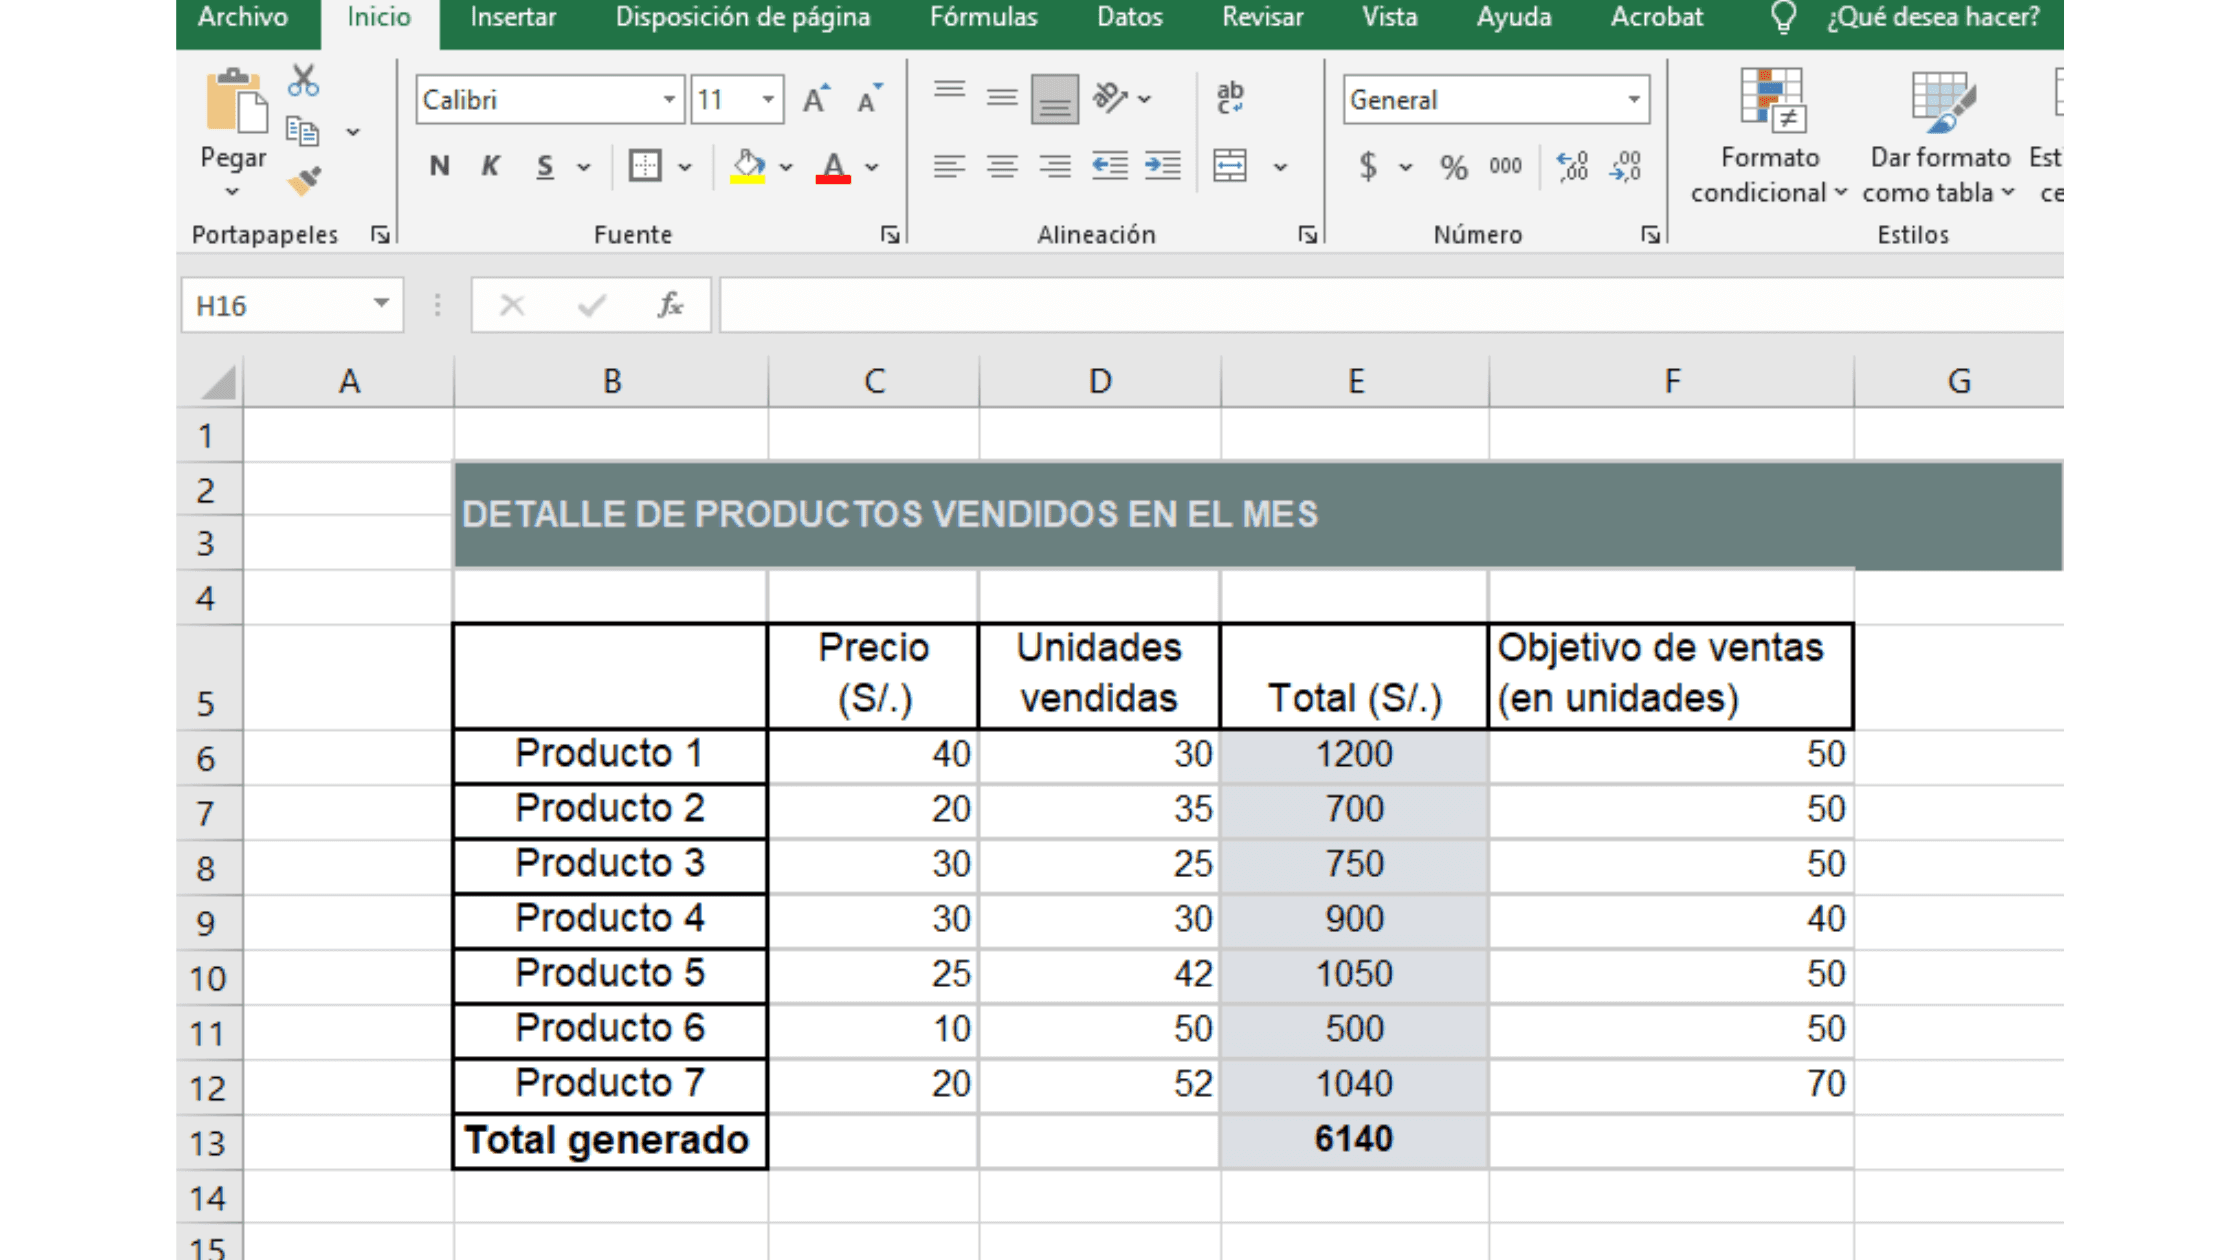
Vamos a crear una tabla de ventas por producto. Para ello, debes incluir el nombre de cada producto de tu inventario, el precio unitario, las unidades vendidas y (super importante) tu meta de ventas.
💡 Tip: El total (S/.) de cada producto se calcula fácilmente con la fórmula “=precio unitario * unidades vendidas”. Aplícala en cada celda de esa columna.
Cómo hacer un reporte de ventas: Paso 2
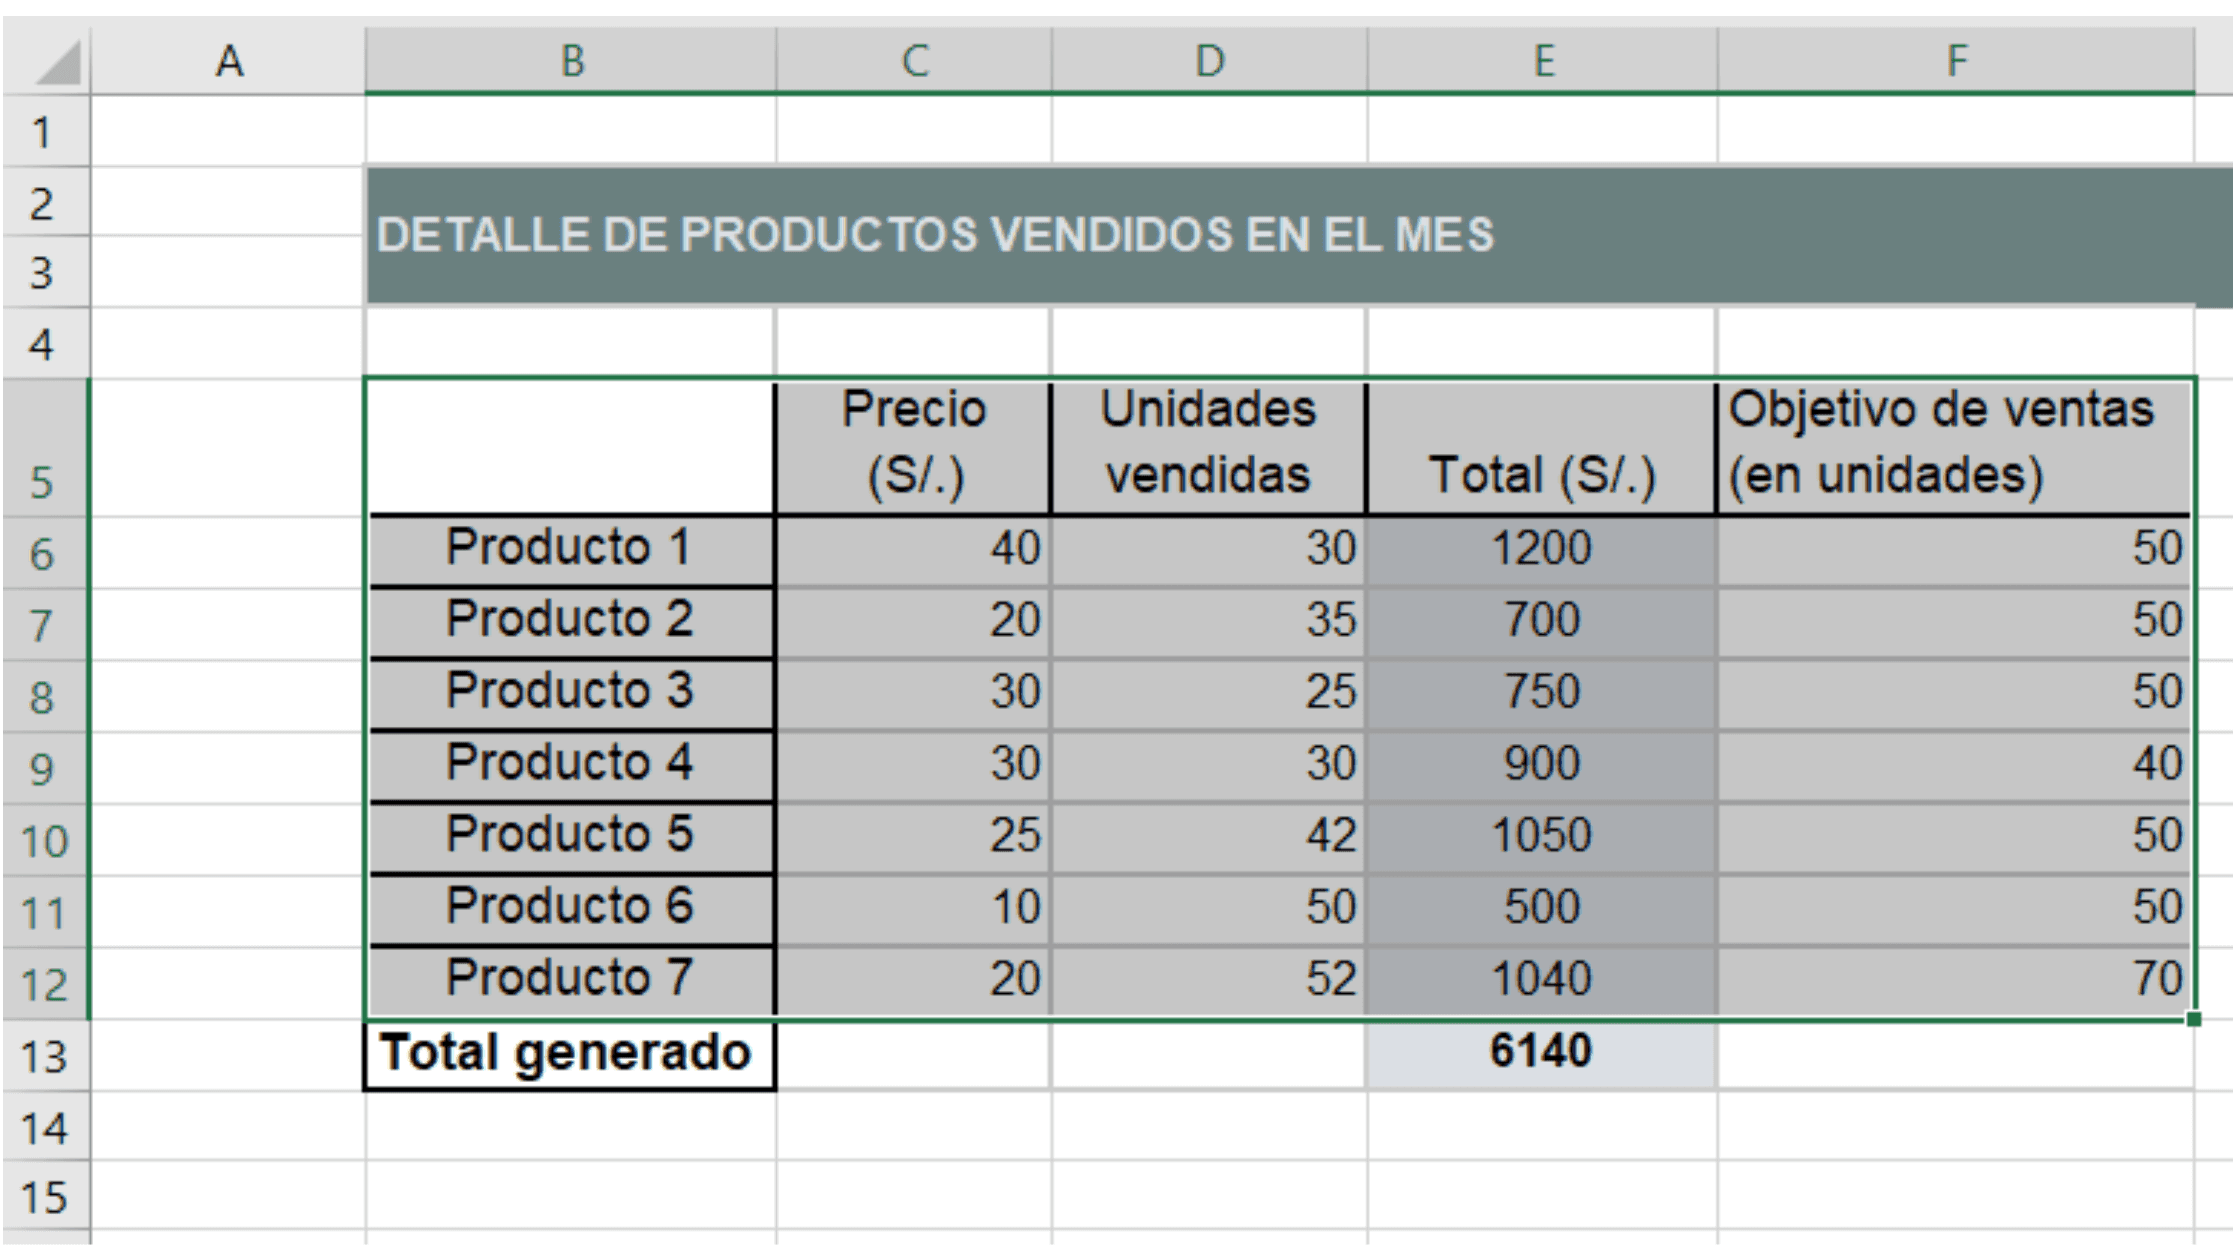
Ahora, selecciona todas columnas con información de tus productos. Asegúrate de incluir los encabezados de la tabla. Así como en esta imagen:
Cómo hacer un reporte de ventas: Paso 3
Para crear el primer gráfico de tu reporte de ventas, realiza lo siguiente. Con tu tabla seleccionada, ve a Insertar > Gráficos recomendados. Se abrirá una ventana como esta:

En la sección “Todos los gráficos”, presiona “Combinado” y elige el último gráfico para una combinación personalizada. Y dale “Aceptar”
Cómo hacer un reporte de ventas: Paso 4
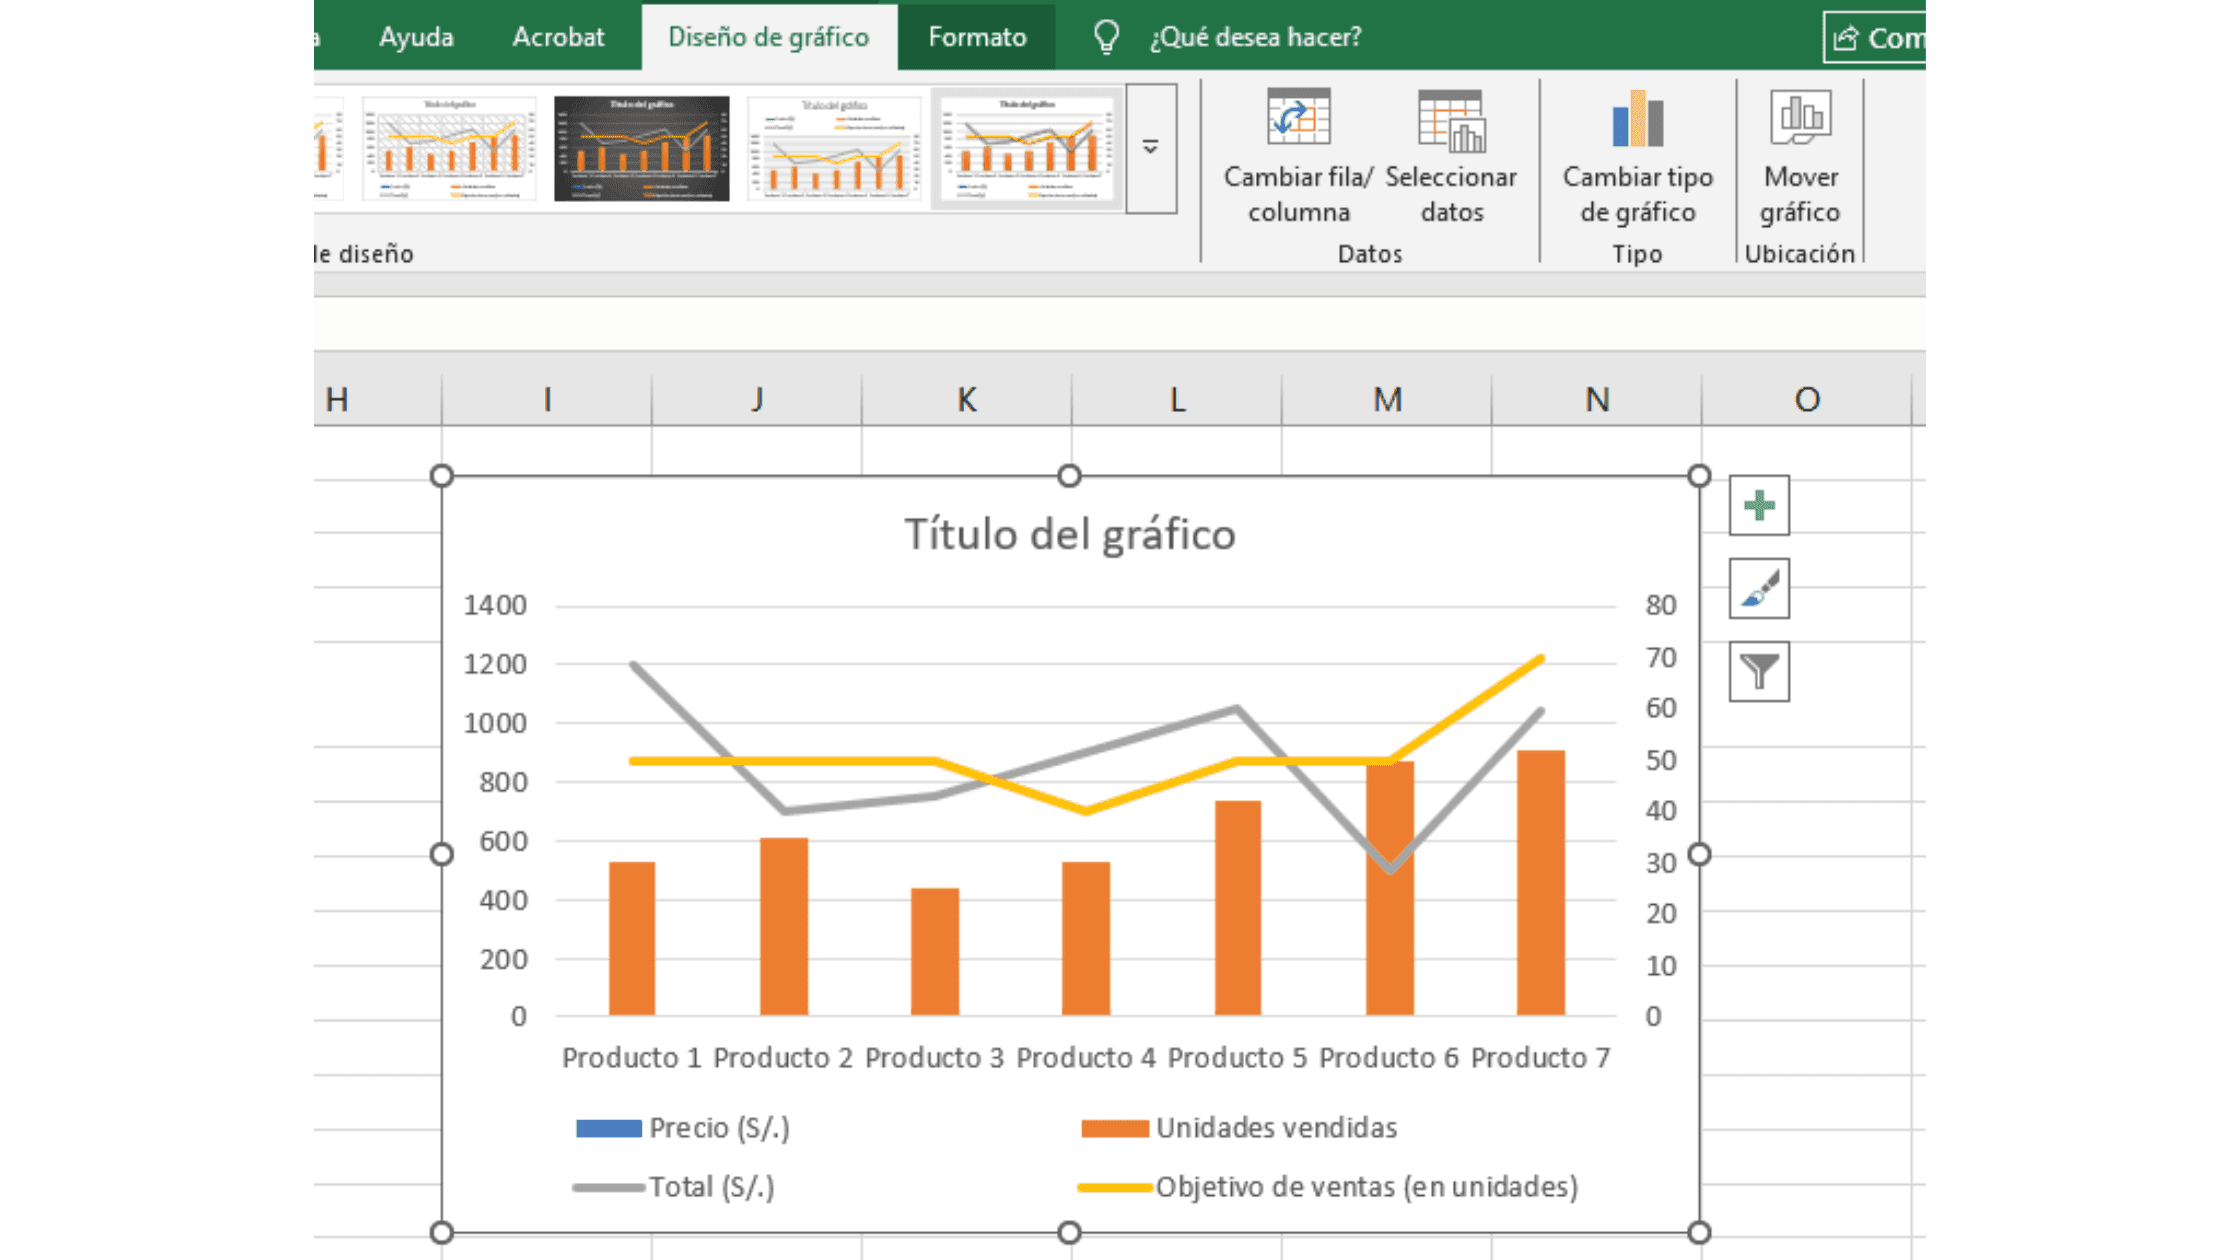
Automáticamente se generará un gráfico con columnas y líneas, pero aún no es el final. Debemos limpiar los datos. Para ello, selecciona tu gráfico y ve a “Seleccionar datos” en la cinta “Diseño de gráfico”
💡 Tip: Los botones para editar tu gráfico se habilitan solo cuando lo seleccionas. Si no lo ves, debes clickear dos veces en él.
Se abrirá una ventana como esta, donde simplemente debes quitar los checks de “Precio (S/.)” y “Total (S/.)”
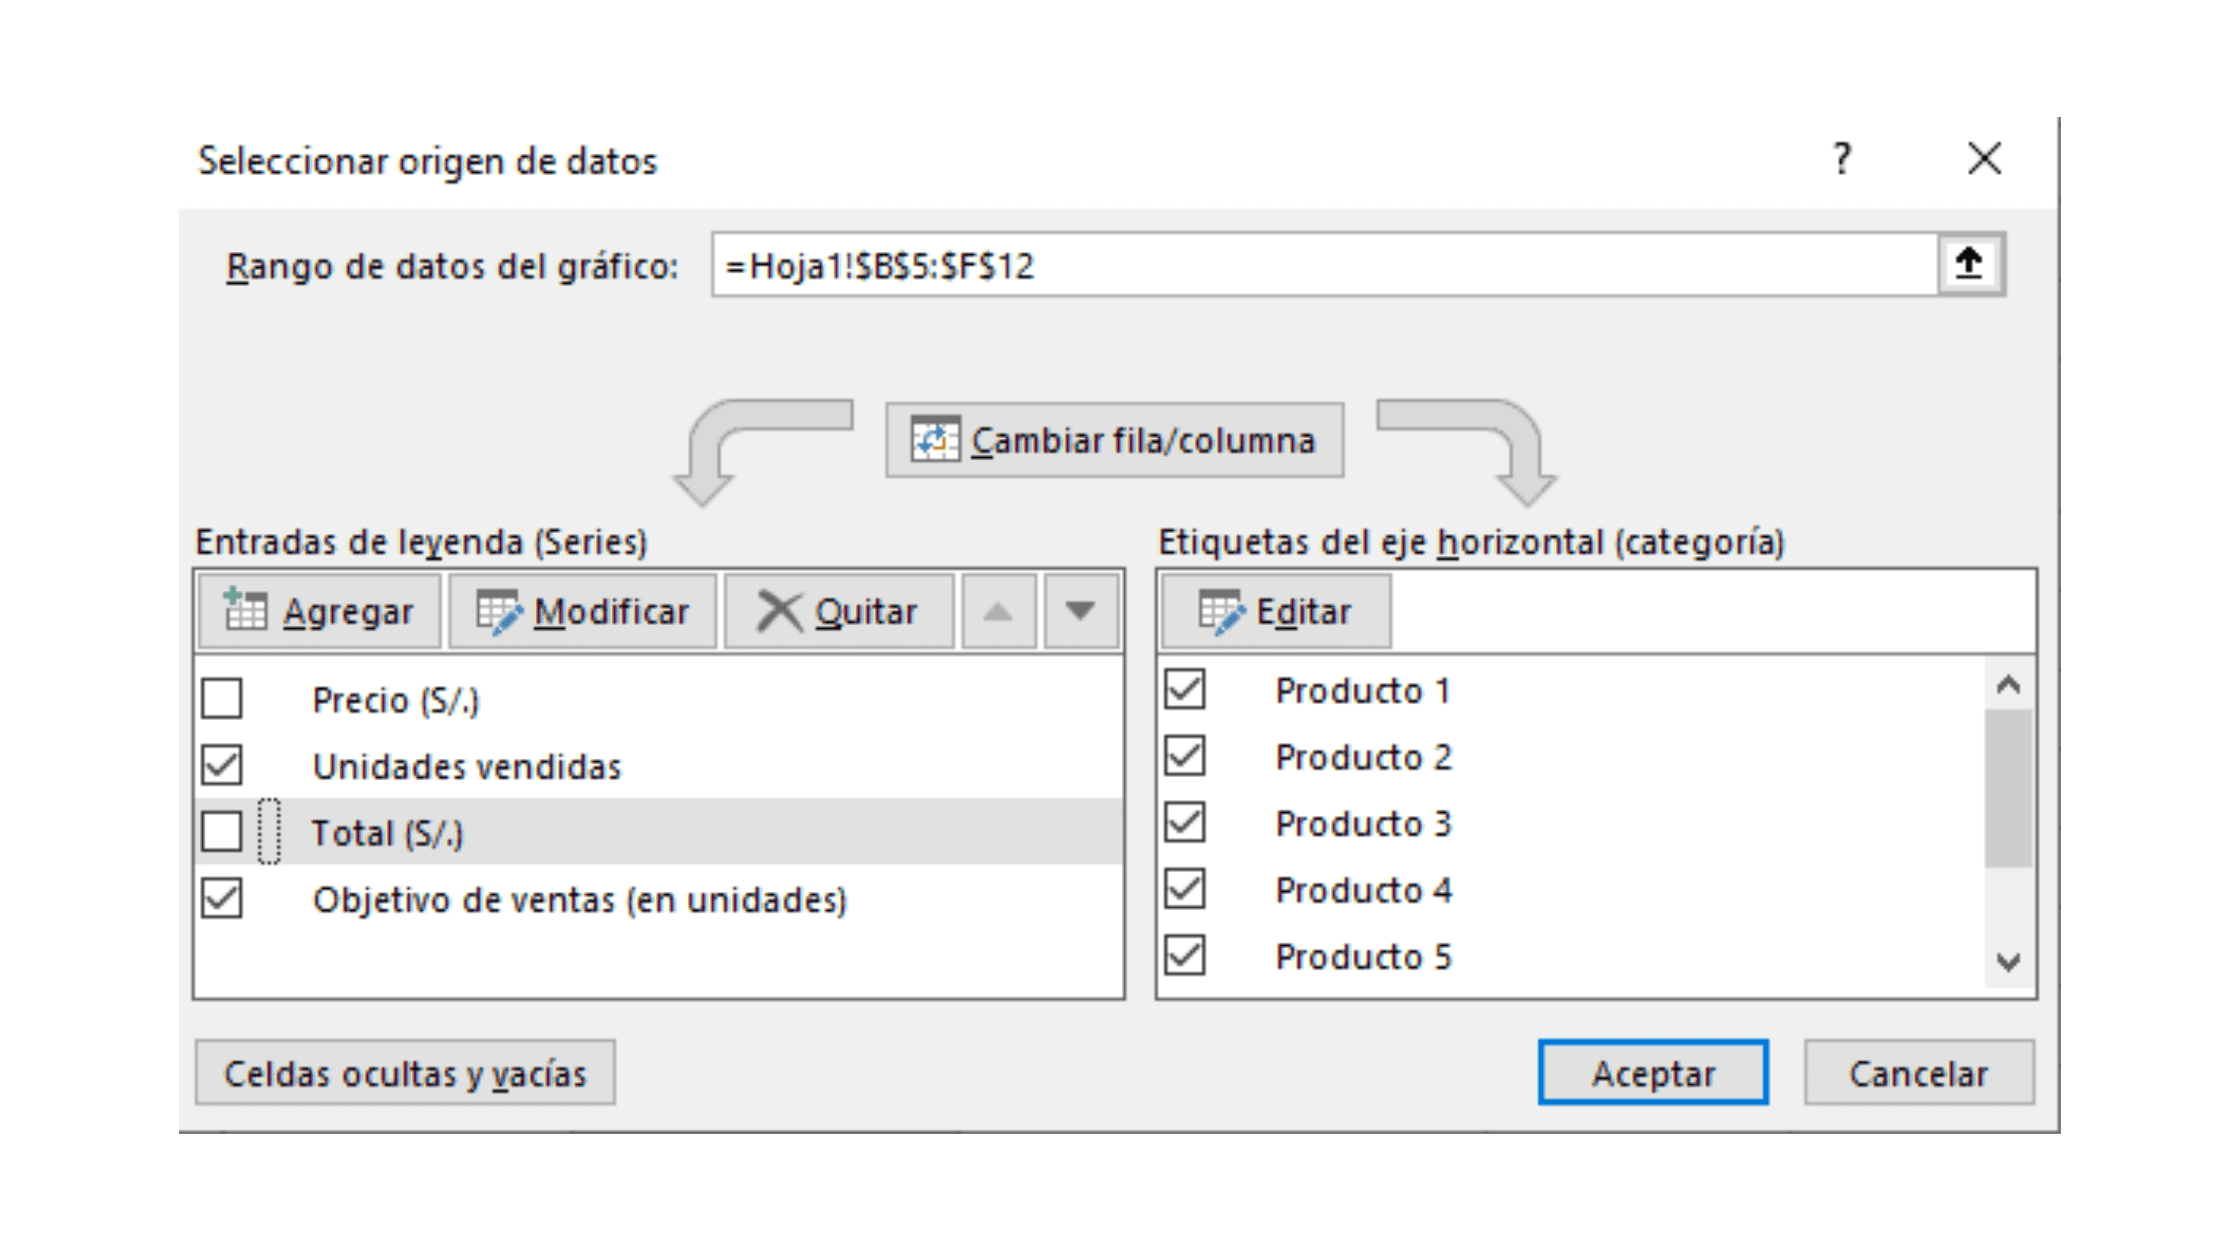
¿La razón? Nuestro objetivo es saber la cantidad de productos que se van vendiendo en la campaña y cuánto falta para llegar a la meta.
Si quisieras esos datos en valor monetario, entonces activa solo las variables (S/.) 😉
Cómo hacer un reporte de ventas: Paso 5
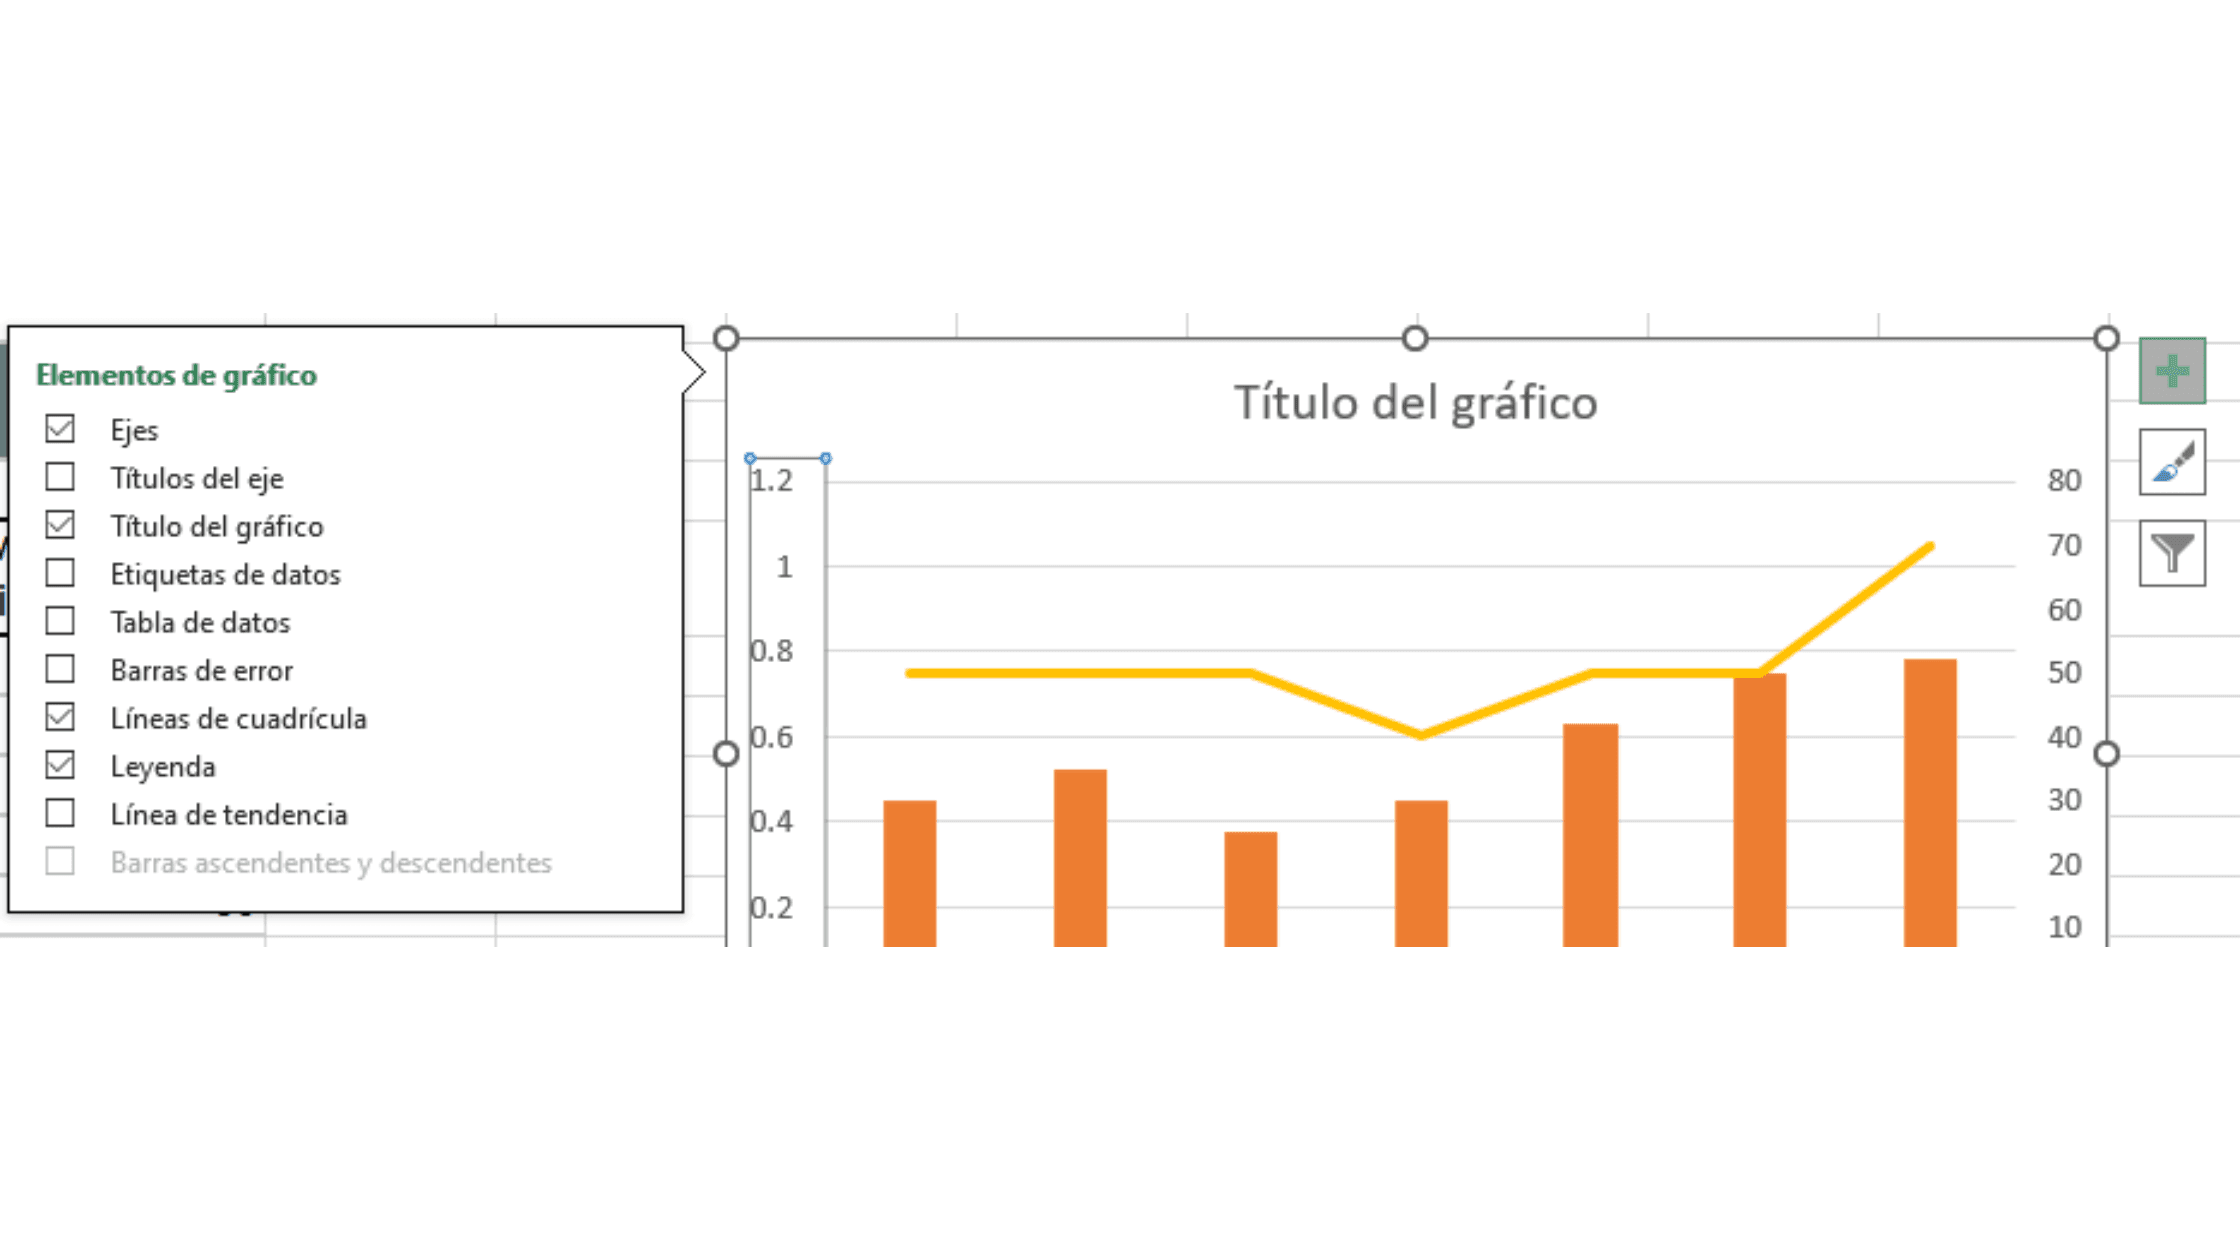
Finalmente, tendrás un gráfico limpio y bastante fácil de leer. Si deseas, puedes cambiar los colores o editar el título a tu gusto.
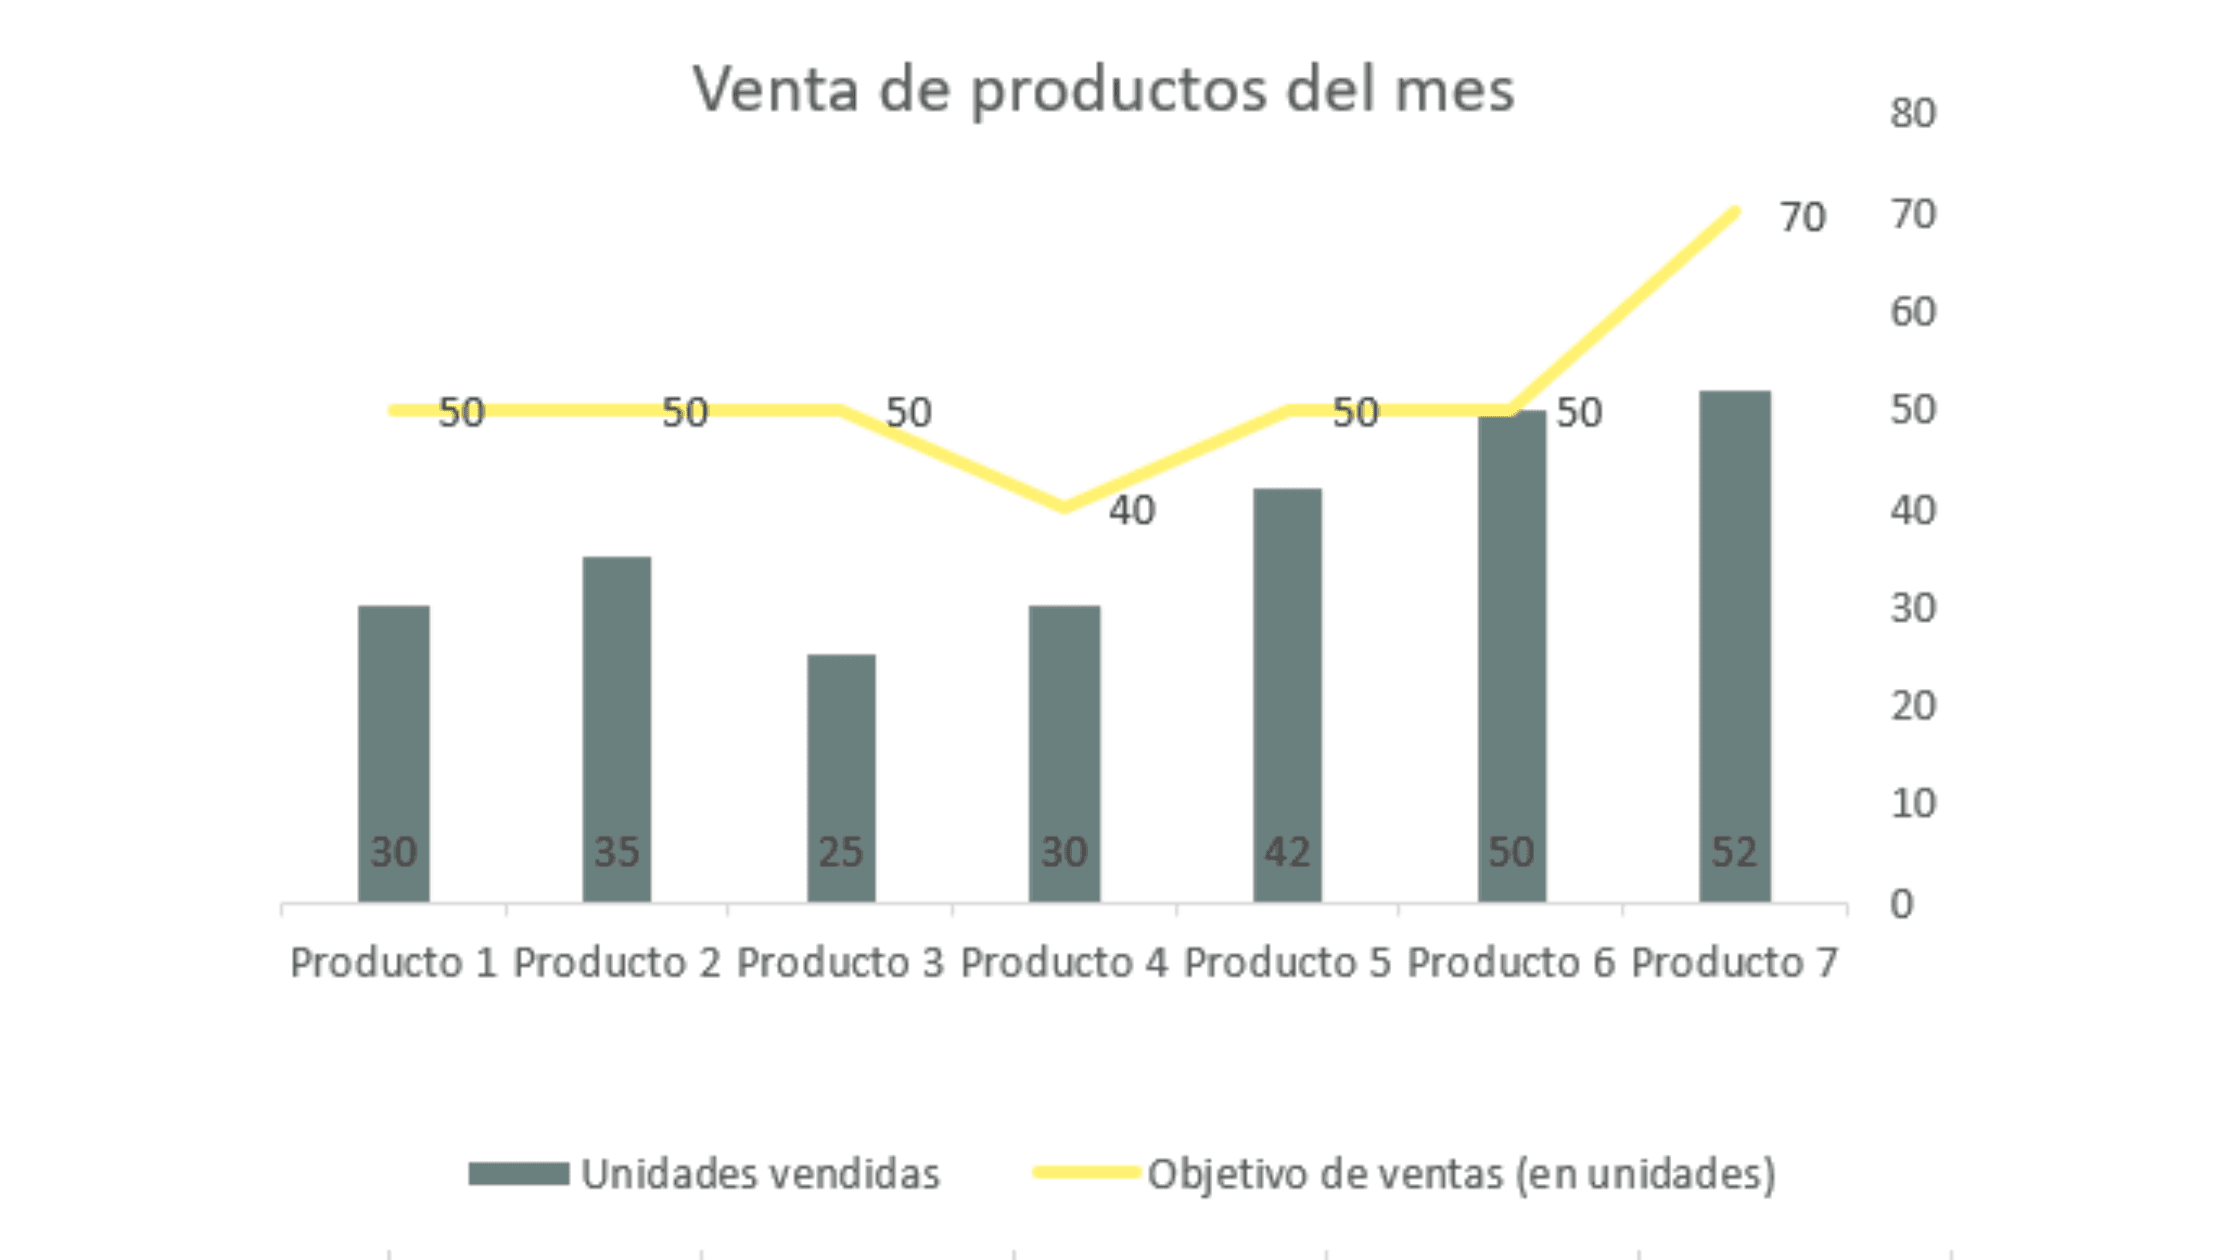
En caso veas unos números de más a uno de los lados, sigue este paso opcional:
Selecciona el gráfico y ve al ícono “+” que aparece al costado. Entra a Ejes > Deselecciona la opción “Vertical Secundario” y ¡listo!
Tipos de reporte de venta
Debes saber que no existe un solo tipo de reporte. Puedes adaptarlo según tu objetivo o lo que necesites analizar. Aquí algunos ejemplos de reportes de venta comunes:
Reporte de ventas diario: Ideal para monitorear el avance de un día a otro, sobre todo en campañas o promociones.
Reporte semanal o mensual: El más común. Te permite ver el comportamiento de las ventas por períodos.
Reporte por producto o categoría: ¡Como nuestro ejemplo! Descubre qué productos generan más ingresos y cuáles tienen baja rotación.
Reporte de vendedores: Si tienes equipo de ventas, puedes ver qué tan efectivos son por persona.
Reporte por canal: Compara el rendimiento entre tienda online, redes sociales, WhatsApp, etc.
Plantila: Reporte de ventas en WhatsApp (descarga gratis🎁)
Y hablando de reportes por canal…si tu canal de ventas principal es WhatsApp, esta plantilla te va a encantar. Obtén gratis la plantilla para reportar tus ventas por WhatsApp aquí:

Incluye:
El embudo de ventas por WhatsApp (con las métricas clave del comercio conversacional)
Registro de tu tasa de conversión por WhatsApp
Tabla detalle de tus productos a vender
Un gráfico de ventas cerradas por día (para que monitorees el rendimiento de tu equipo)
Y claro, el gráfico de venta de productos del mes (¡el que vimos en nuestro ejemplo!)
Tómalo como la base para desarrollar tu propio reporte de ventas.
Métricas para un reporte de ventas efectivo
Ahora, si quieres hacer tus reportes de venta por WhastApp aún más potentes y estratégicos puedes añadir estas métricas:
Producto más vendido
Horario con más ventas
Tiempo promedio de respuesta
# de conversaciones sin respuesta
Calificación promedio de atención
# de clientes recurrentes
Incluye una sección cualitativa para insights y oportunidades con estas preguntas:
¿Qué funcionó bien esta semana?
¿Qué se puede mejorar?
¿Qué oportunidades de automatización se detectaron?
Vende más en WhatsApp con un vendedor virtual 🤖
Ya sabes cómo hacer un reporte de ventas que te dé claridad sobre lo que funciona en tu negocio. Ahora imagina tener un canal de ventas que trabaje para ti 24/7, sin que tengas que estar pegado al celular.
Conoce a YaVendió! y nuestra inteligencia artificial (IA) para WhatsApp - diseñada especialmente para negocios que venden por Internet. Con YaVendió! podrás tener un vendedor virtual de IA que atiende a tus clientes al instante, recomienda productos y hasta cierra ventas sin intervención humana.
¿Quieres ver cómo funciona? Escríbenos hoy por WhatsApp y te mandamos un demo gratis.
Si alguna vez te has preguntado cómo hacer un reporte de ventas para tu tienda online, estás en el lugar correcto. Porque sí, los reportes no son solo para grandes empresas: también son la clave para que un negocio e-commerce pequeño crezca con inteligencia.
En este artículo, te guiaré paso a paso en cómo crear un reporte de ventas básico en excel. Veremos qué elementos debe tener tu reporte y los tipos de reporte más comunes. Además, podrás descargar un reporte de ventas editable 📊 para registrar tus ventas por WhatsApp.
Gracias al equipo de YaVendió!, expertos en e-commerce, esta plantilla tiene todas las métricas de venta más importantes de WhatsApp ¡Imperdible! ⚡
Pero, iniciemos por lo fundamental:
¿Qué es un reporte de ventas?
Un reporte de ventas es un documento estratégico que recopila y analiza los datos de todas tus ventas en un periodo específico con el objetivo de entender el rendimiento comercial, identificar oportunidades de mejora y tomar decisiones basadas en datos reales.
No se trata solo de saber cuánto se vendió, sino de entender por qué se vendió, a quién, cómo y con qué rentabilidad. Un buen reporte de ventas puede revelar patrones de comportamiento de clientes, el impacto de campañas de marketing y la eficiencia del equipo de ventas.
En negocios donde cada dato cuenta, el reporte de ventas se convierte en una herramienta poderosa para crecer de forma sostenible y con foco en la rentabilidad.
Elementos clave: ¿Qué debe incluir un reporte de ventas?
Todo reporte de ventas profesional debe contener algunos elementos básicos, como:
Fecha, mes o período reportado
Producto o servicio vendido
Cantidad en unidades
Precio unitario y total
Canal de venta (tienda online, WhatsApp, redes, etc.)
Meta u objetivo de venta
Y si quieres un nivel extra de análisis:
Tasa de conversión (te recomiendo este artículo sobre tasas de conversión en e-commerce)
Agente de ventas asignado (si aplica)
Cliente (nombre, zona, tipo)
Costo de adquisición del cliente (CAC)
Margen de ganancia
Tener estos datos bien organizados es el primer paso para comprender el estado de tus ventas.
Cómo hacer un reporte de ventas en Excel en 5 pasos
Ahora que ya sabes qué es un reporte de ventas y qué debe incluir, es momento de pasar a la práctica.
Aquí te explico cómo hacer un reporte de ventas en Excel en 5 pasos. Cada paso está pensado para que tu informe sea claro, fácil de actualizar y útil para tomar decisiones de negocio.
👉 Para este ejemplo, pensemos que tu equipo está en campaña de Navidad y hay un inventario determinado que vender. Por ende, el objetivo es conocer la cantidad de productos que salen y si se llegarán a la meta.
Cómo hacer un reporte de ventas: Paso 1
Vamos a crear una tabla de ventas por producto. Para ello, debes incluir el nombre de cada producto de tu inventario, el precio unitario, las unidades vendidas y (super importante) tu meta de ventas.
💡 Tip: El total (S/.) de cada producto se calcula fácilmente con la fórmula “=precio unitario * unidades vendidas”. Aplícala en cada celda de esa columna.
Cómo hacer un reporte de ventas: Paso 2
Ahora, selecciona todas columnas con información de tus productos. Asegúrate de incluir los encabezados de la tabla. Así como en esta imagen:
Cómo hacer un reporte de ventas: Paso 3
Para crear el primer gráfico de tu reporte de ventas, realiza lo siguiente. Con tu tabla seleccionada, ve a Insertar > Gráficos recomendados. Se abrirá una ventana como esta:
En la sección “Todos los gráficos”, presiona “Combinado” y elige el último gráfico para una combinación personalizada. Y dale “Aceptar”
Cómo hacer un reporte de ventas: Paso 4
Automáticamente se generará un gráfico con columnas y líneas, pero aún no es el final. Debemos limpiar los datos. Para ello, selecciona tu gráfico y ve a “Seleccionar datos” en la cinta “Diseño de gráfico”
💡 Tip: Los botones para editar tu gráfico se habilitan solo cuando lo seleccionas. Si no lo ves, debes clickear dos veces en él.
Se abrirá una ventana como esta, donde simplemente debes quitar los checks de “Precio (S/.)” y “Total (S/.)”
¿La razón? Nuestro objetivo es saber la cantidad de productos que se van vendiendo en la campaña y cuánto falta para llegar a la meta.
Si quisieras esos datos en valor monetario, entonces activa solo las variables (S/.) 😉
Cómo hacer un reporte de ventas: Paso 5
Finalmente, tendrás un gráfico limpio y bastante fácil de leer. Si deseas, puedes cambiar los colores o editar el título a tu gusto.
En caso veas unos números de más a uno de los lados, sigue este paso opcional:
Selecciona el gráfico y ve al ícono “+” que aparece al costado. Entra a Ejes > Deselecciona la opción “Vertical Secundario” y ¡listo!
Tipos de reporte de venta
Debes saber que no existe un solo tipo de reporte. Puedes adaptarlo según tu objetivo o lo que necesites analizar. Aquí algunos ejemplos de reportes de venta comunes:
Reporte de ventas diario: Ideal para monitorear el avance de un día a otro, sobre todo en campañas o promociones.
Reporte semanal o mensual: El más común. Te permite ver el comportamiento de las ventas por períodos.
Reporte por producto o categoría: ¡Como nuestro ejemplo! Descubre qué productos generan más ingresos y cuáles tienen baja rotación.
Reporte de vendedores: Si tienes equipo de ventas, puedes ver qué tan efectivos son por persona.
Reporte por canal: Compara el rendimiento entre tienda online, redes sociales, WhatsApp, etc.
Plantila: Reporte de ventas en WhatsApp (descarga gratis🎁)
Y hablando de reportes por canal…si tu canal de ventas principal es WhatsApp, esta plantilla te va a encantar. Obtén gratis la plantilla para reportar tus ventas por WhatsApp aquí:
Incluye:
El embudo de ventas por WhatsApp (con las métricas clave del comercio conversacional)
Registro de tu tasa de conversión por WhatsApp
Tabla detalle de tus productos a vender
Un gráfico de ventas cerradas por día (para que monitorees el rendimiento de tu equipo)
Y claro, el gráfico de venta de productos del mes (¡el que vimos en nuestro ejemplo!)
Tómalo como la base para desarrollar tu propio reporte de ventas.
Métricas para un reporte de ventas efectivo
Ahora, si quieres hacer tus reportes de venta por WhastApp aún más potentes y estratégicos puedes añadir estas métricas:
Producto más vendido
Horario con más ventas
Tiempo promedio de respuesta
# de conversaciones sin respuesta
Calificación promedio de atención
# de clientes recurrentes
Incluye una sección cualitativa para insights y oportunidades con estas preguntas:
¿Qué funcionó bien esta semana?
¿Qué se puede mejorar?
¿Qué oportunidades de automatización se detectaron?
Vende más en WhatsApp con un vendedor virtual 🤖
Ya sabes cómo hacer un reporte de ventas que te dé claridad sobre lo que funciona en tu negocio. Ahora imagina tener un canal de ventas que trabaje para ti 24/7, sin que tengas que estar pegado al celular.
Conoce a YaVendió! y nuestra inteligencia artificial (IA) para WhatsApp - diseñada especialmente para negocios que venden por Internet. Con YaVendió! podrás tener un vendedor virtual de IA que atiende a tus clientes al instante, recomienda productos y hasta cierra ventas sin intervención humana.
¿Quieres ver cómo funciona? Escríbenos hoy por WhatsApp y te mandamos un demo gratis.
May 9, 2025
Discover More

Cyber Wow 2025: Fechas, cómo funciona y cómo vender más
Cyber Wow 2025: Fechas, cómo funciona y cómo vender más
Cyber Wow 2025: Fechas, cómo funciona y cómo vender más

The biggest sales days of the year 2025 (US E-commerce Calendar)
The biggest sales days of the year 2025 (US E-commerce Calendar)
The biggest sales days of the year 2025 (US E-commerce Calendar)
Bring the magic to your sales TODAY!

Bring the magic to your sales TODAY!
Bring the magic to your sales TODAY!
@2024 YA VENDIO - All rights reserved
@2024 YA VENDIO - All rights reserved